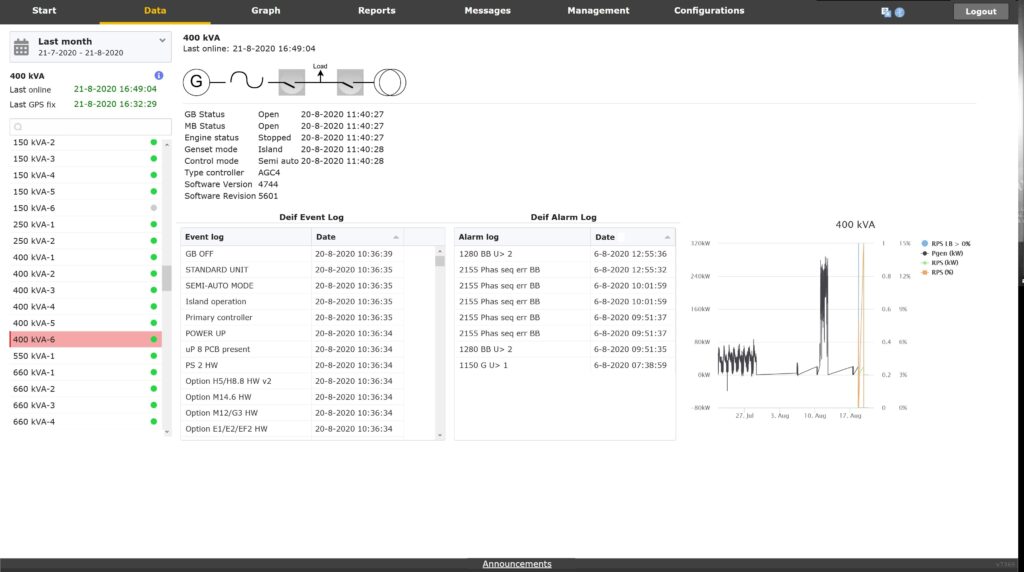
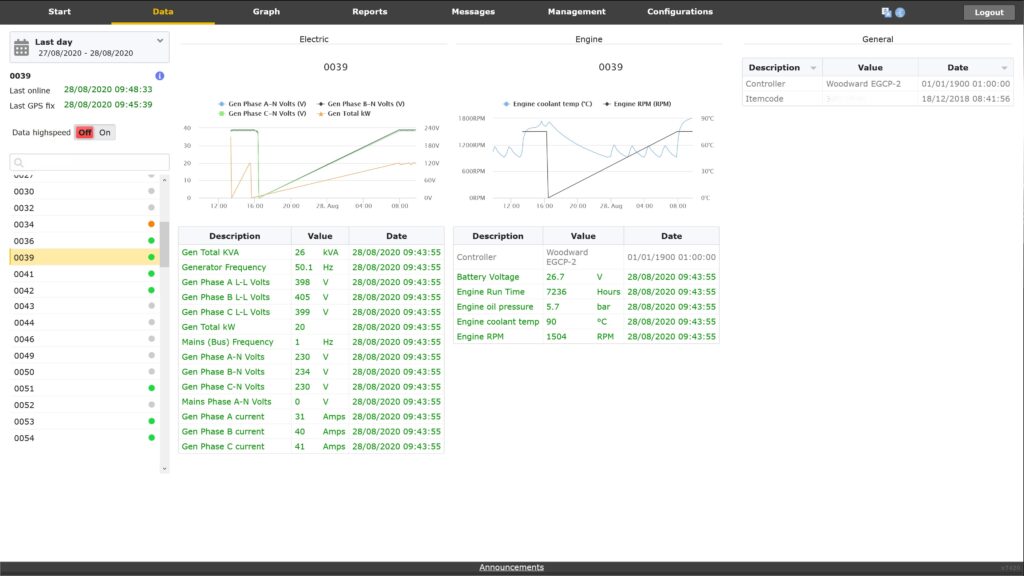
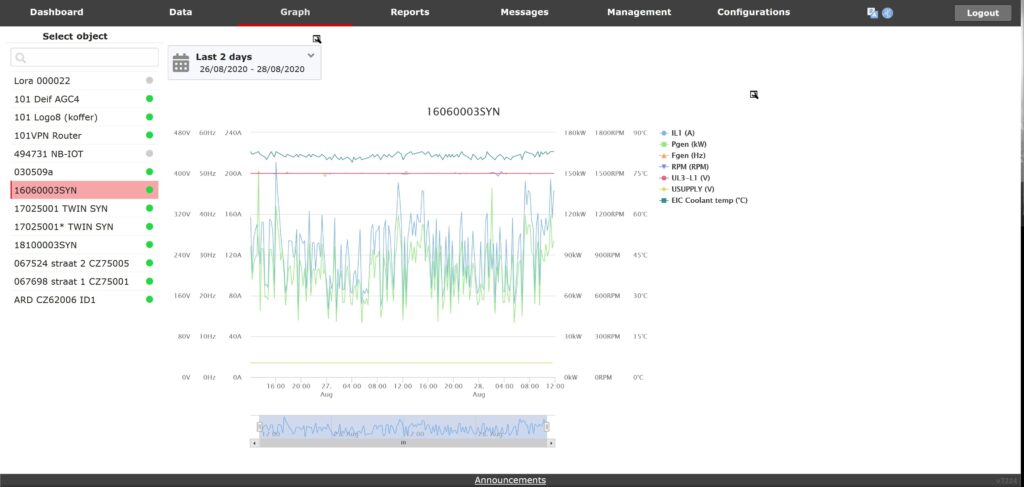
Dashboards
Here you can see some examples of screens from our web portal. The Dashboard tab is set up according to the wishes of the customers. Depending on your information needs, graphs, a map, diagrams or other forms of presentation are included.
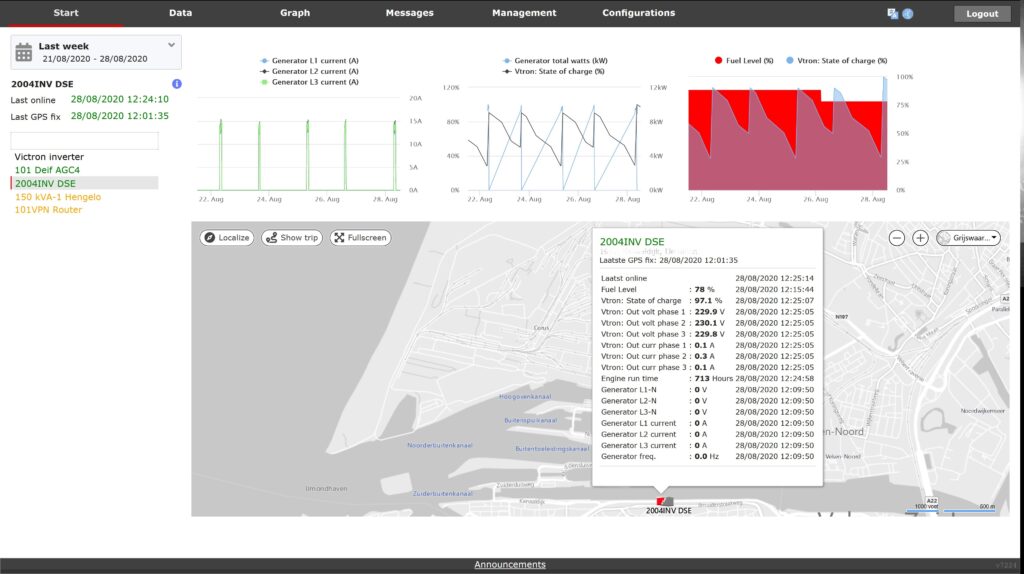
Figure 1: Dashboard DSE controller combined with Victron